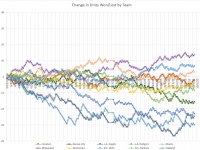
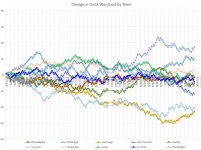
I like to track a teams performance in terms of units W/L throughout the season. I look for trends to see if they are heading one way or the other. A team trending up is doing much better than they were expected to.
Here are the EOY charts for each team, in alphabetical order.
The flat lines in the middle are all-star break.
Chart1:
> Baltimore was just steadily racking up the units all season. They outperformed from day 1.
> Chicago White Sox sucked the entire year.
> Atlanta the best team in MLB ended up around +5 units because the odds on games expected them to be good all year.
Chart 2:
> KC was bad until the last few weeks. Maybe their minor league players being called up show there's a future.
Chart 3:
> Similar to KC, SD only showed up at the end.
There is a lot more that can be read into this data but I always find it interesting how teams do over the entire season.


